SURFACTANT
The word surfactant stands for the portmanteau of the words ‘Surface’ and ‘Active’. Surfactants are amphiphilic in nature. It has an affinity to a polar medium (water) and a non-polar medium (hydrocarbon). The dual affinity of surfactant molecules result in a mono-layer between two mediums (Schramm. et. al., 2003). This mono-layer causes a decrease in interfacial tension (IFT) and forms a micro-emulsion between oil and water, this micro-emulsion, with low IFT moves with ease thorough the pore space.
The surfactant molecule consists of a hydrophilic head and a hydrophobic tail (Figure 1). The hydrophobic tail (can be either straight or branched) of the surfactant molecule interacts more strongly with the oil molecules while the hydrophilic head has more affinity towards the water molecule (solvation). The solubility of the surfactant molecule depends on the hydrophilic to lipophilic ratio (HLB). This ratio characterizes the tendency of surfactant to solubilize in either oil or water and form water in oil or oil in water emulsions respectively. For instance, higher HLB results in the surfactant molecule being more soluble in oil system and forms water in oil emulsion (Paul Willhite. et al., 1998). Many such surfactant molecules combine together and form micelles. The oil molecules form the interior of the micelle while the exterior or the hydrophilic head of the micelle clings to the water molecules (Figure 2).
The hydrophilic head of the surfactant molecule is a characteristic parameter in defining the types of surfactant, classified as anionic, cationic, non-ionic and zwitterionic (Schramm. et. al., 2003).
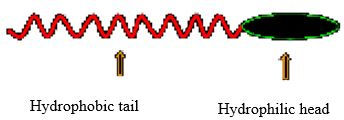
Figure 1 Structure of a Surfactant molecule (Paul Willhite. et al. 1998)
Figure 1 above shows a surfactant molecule with its hydrophilic head and hydrophobic tail, while figure 2 below shows a micelle structure, once surfactant molecules unite. The micelles attribute toward forming micro-emulsions with low IFT values.
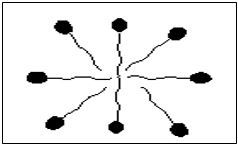
Figure 2 Structure of a surfactant micelle (Schramm. et al. 2003)
Types of Surfactants
Surfactants are classified on the basis of the ionic charge of the hydrophillic head of the surfactant as follows:
- Anionic: As the name suggests anionic surfactants have a negative head group. These negatively charged surfactants help in lowering the IFT and can be manufactured economically. Their biggest advantage lies in their resistant nature to retention which can be attributed to the negative charge of the head group. As the head group is negatively charged, these surfactants repel against the negatively charged interstitial clay. Due to such advantageous properties, anionic surfactants are widely used in EOR techniques. Internal Olefin Sulfonate (IOS), an anionic surfactant, shows good tenacity against high temperature. Such surfactants can be used in reservoirs having high temperature since the stability of the surfactant will remain intact. A vast amount of research has been carried out on IOS surfactants as potential tools in surfactant flooding. Blending of various anionic surfactants to arrive at the best surfactant slug is an idea which has come forward in the 21st century. Levitt et al. studied a blend of IOS and propoxy sulfate and found promising laboratory results.
- Non-ionic: These surfactants have a head group which has no ionic charge, hence the name non-ionic surfactants. These surfactants are generally used as co-surfactants, albeit after the chromatographic separation effects between the surfactants and the co-surfactants are studied. Common examples include alcohol, ester, ethers, etc.
- Cationic: These are positively charged surfactants. These surfactants are occasionally used for EOR as they are adsorbed at the surface of interstitial clay due to the negative charge of the clay minerals and the positive charge of the

Figure 3 Types of Surfactants (Schramm et al. 2000)
surfactant molecule, this causes attraction between the two which results in loss of expensive surfactant from adsorption. The lower permeability reservoirs might add to their retention by phase trapping.

Figure 4 Examples of different types of Surfactants (Schramm et al. 2003)
- Zwitterionic (Amphoteric): These surfactants have a negative as well as a positive group head as shown in figure 5. Zwitterionic surfactants are known for their robust structure, high tolerance to salinity and temperature (Alhasan Fuseni et al. 2013). Needless to say, these surfactants are used in harsh reservoirs and have immense potential for EOR in future. A healthy amount of research is already underway (Zhou Xianmin et al. 2012, Bataweel et al. 2012).

Figure 5 Diagram showing structure of Gemini surfactant molecule (Bo Gao et al.2013)
Besides these four general surfactant types, there also exist a few other less used surfactants like Viscoelastic surfactants (VES) and Gemini surfactants. Gemini surfactants are described as dimeric surfactants as the surfactant molecules have two head groups and two tails per surfactant molecule, which are linked by spacer group (Shramm. et al. 2000). Developed in late 1980s and early 1990s, these surfactants can either be Cationic, Anionic, Non-ionic or Zwitterionic Gemini depending on the hydrophilic head of the surfactant molecule. The great advantage of Gemini surfactants over single-tail, single-head surfactants is that, they have low Critical Micelle Concentration (about an order of magnitude) (CMC) and can be used in low permeability reservoirs. They also exhibit high surface activity, better stability, low IFT at CMC and high hard-water tolerance. Figure 2.5 shows the basic structure of a Gemini surfactant molecule.
MICROEMULSION AND CMC
The term micro-emulsion was first used by Schluman et.al in 1977. These micro-emulsions form colloidal solution. The use of the word micro-emulsion was in debate after it was coined, Shinoda’s and Kunieda’s work stands a case in point. According to Healy and Reed, a micro-emulsion is defined as a stable, translucent micellar solution of oil, water that may contain electrolytes and one or more aphiphilic compounds (surfactant, alcohol) (Healy and Reed, 1974).
Micro-emulsions contain micelles that solubilize the immiscible phase with the solvent in the micro-emulsion solution. These micelles are called as swollen micelles. With the right amount of concentration of micro-emulsions, a significant amount of oil can be solubilized.
At low concentration of a surfactant in a solution, the surfactant molecules are dispersed randomly. These random surfactant molecules are called as monomers. However, as the concentration of the surfactant molecules increases, they start aggregating together to make the insoluble phase soluble. The coalesced surfactant molecules form a sphere, like a droplet of a liquid substance, which are called as micelles. These micelles later form a micro-emulsion.
The micelles only start forming after a certain value of a surfactant concentration. This value is called the Critical Micelle Concentration of a given surfactant. Once, the concentration has reached CMC and micelles are formed, the surfactant monomers stop getting dispersed in the solution but start getting added into the micelles. This is an important phenomenon when surfactants are used in EOR techniques. This can be explained by stating that after reaching CMC the surfactant injection should be stopped as the added surfactant will only aggregate with micelles and not contribute to further IFT reduction. Adding more surfactant to the solution after achieving CMC will cause its wastage and increase the expenditure of the EOR project.
When a surfactant is added to the immiscible phases of water and oil, they form micelles which convert the immiscible phases into a single solution. The single solution formed can either be water in oil type or oil in water type. This helps in increasing the microscopic sweep efficiency. Microscopic sweep efficiency as the name suggests increases the mobility of the oil bank formed by the surfactant micelles on the scale of pore spaces. This simply means that the solution of water and oil moves with more ease in the pore spaces of the reservoir.

Figure 6 Micelles Left: oil-in water, Right: water-in oil (Paul & Willhite., 1998)
Figure 6 shows 2 different types of micro-emulsions a surfactant can form with the oil-water system, while figure 7 exhibits the formation of micelle at critical micelle concentration of surfactants.

Figure 7 Formation of Micelles from monomers (Paul & Willhite., 1998)

Figure 8 Graphical representation of relationship between CMC and Micelles
PHASE BEHAVIOR
Phase behavior studies of surfactants slugs to evaluate the robustness and IFT reduction capacity were carried out in the era of 1980s and 1990s (Puig J. E. et al. 1979, Hall A. C. 1980). Micro-emulsion systems between oil, water and surfactant can be designed which have ultralow IFT’s (order of magnitude 10-3 dynes/cm). This is one of the mechanisms of surfactant flooding.
Phase behavior studies are tedious as the micro-emulsion systems are sensitive to the structure and concentration of surfactant slug (which includes surfactant, co-surfactant (usually an alcohol or another surfactant), oil and brine water), temperature and pressure. Phase behavior studies evaluate regions where solubilization caused by micelles is maximum and the micro-emulsion is least affected by the above mentioned parameters. In literature, there are not any universally accepted mathematical equations which can be used to evaluate the phase behavior studies of surfactant. This results in laboratory evaluation of the micro-emulsions, where micro-emulsion structures are studied experimentally. The results obtained from the experiments are produced in the form of graphs which can be used in different computer softwares (for instance UTCHEM) to create mathematical model.
Healy and Reed in 1974 studied the phase behavior of surfactants with the help of ternary diagrams. The concept of ternary diagram was introduced on the basis of the principle that the micro-emulsion at least consist of three components namely, oil, water and surfactant. The most ideal system was considered to have these three phases after the equilibrium between the three components was achieved. The system with an ideal amount of all the three phases was a stabilized one. There exist three types of scenarios for a system. The type of system will depend on how the phase behavior changes take place while the three phases try to achieve equilibrium. These three types are Winsor type I, Winsor type II and Winsor type III. Winsor type I forms a lower phase equilibrium region, which means the lower phase micro-emulsion attains equilibrium with the oil above it. This type is also referred as Winsor type II-, where II means that two phases exist in the system. In this system the solubility of the surfactant is more towards the brine region (lower phase) as there is an electro-static force acting continuously between the surfactant ions and the uneven distribution of water dipole (O- H+). The water dipole moment results in solubilization of surfactant in the brine region due to which IFT of the system remains high. Only a small amount of oil is seen in the solubilized region. Winsor type II system exists when surfactants solubilize the upper phase region of the system with the lower excessive brine phase region. This type also has only two phases co-existing together. The lower region phase is purely aqueous with brine water and the upper solubilized phase with excessive oil. This type will not reduce the IFT adequately for the oil to be produced. Winsor type III shows a co-existence of water, oil and surfactant in the micro-emulsion. When the solution reaches type III state equilibrium is established between the three phases mentioned above and results in the formation of an oil bank in the middle region occupied by the micro-emulsion. Winsor type III is considered the most productive as it reduces the IFT to the least value when compared to the other 2 types. The varying salinity conditions from the optimal salinity requirement cause variations in the type III system.

Figure 9 Winsor type I system (salager et al., 1979)
Figures 9, 10 and 11 show the winsor types behavior I, II and III respectively. Winsor type III behavior is considered the most ideal of the micro-emulsions a surfactant can form with an oil-water system.

Figure 10 Winsor type II system (salager et al., 1979)

Figure 11 Winsor type III system (salager et al., 1979)
Healy and Reed and Healy et.al. studied the effect of salinity on the phase behavior of a micro-emulsion. It was found that the stability of three phase micro-emulsion which has the lowest value of IFT exists only for a selected range of salinity and the mid-point of this range was the value called as optimum salinity value (S*). Optimum salinity gives the right amount of density to the micro-emulsion to solubilize required amount of water and oil in the middle region. However, if the salinity is more than the optimal salinity, the micro-emulsion region witnesses change from the required type III system and transform’s into type I or type II with increase or decrease in salinity respectively (Figure 12)

Figure 12 Effect of changing salinity on type III system (Paul & Willhite 1998)
Figure 12 as explained shows the effect of salinity on the Winsor type micro-emulsion formed by surfactants and figure 13 shows the actual test done to check the effect of salinity on the ability of surfactant to form micro-emulsions.

Figure 13 Micro-emulsion type changes with increasing salinity to the right (Ted Davis et al., 1980)
Phase Behavior Observation
Phase behavior testing is an important part of the screening process of surfactants. Phase behavior testing is carried out for a surfactant at a particular temperature, hydrocarbon and surfactant concentration.
Generally, a small quantity (usually 2ml) of sample of oil-water-surfactant mixture is pipetted into a long pipette (usually 5 ml) and then placed in an oven with a specific temperature set to match the reservoir temperature. After the temperature is reached the pipettes are inverted several times. The solutions in the pipettes are later studied to observe the phase behavior.
The solution is studied to observe the changes in the micro-emulsion region. It is also studied to observe the changes in Winsor types the micro-emulsion system goes through. The salinity is kept on increasing in small intervals to study the effect of salinity and parameters like Optimal salinity (S*) and Solubilization ratio (σ*) are measured through graphs. For a given system of oil-surfactant-water, solubilization ratio is the volume oil and water being solubilized by a unit amount of surfactant (Paul & Willhite 1998). Figure 2.14 from a DOE report of surfactant evaluation shows the graphical method of obtaining the value of S* and σ*.

Figure 14 Solubilization and Optimal salinity graphs (Hirasaki et al., DOE report 2004)