Data collected in this report is from 134 CO2 projects, including reservoir properties, reservoir fluid properties, and operation parameters.
Overall Project Evaluation
Out of the 134 CO2 flooding projects, 91 projects were evaluated as successful. Oil recovery was enhanced significantly after CO2 injection. Commercial successes were also achieved through these projects. 18 projects were considered as promising, as favorable enhanced oil recovery methods are developed and with continuous injection or strategy adjustment, satisfactory recovery may be reached. 15 projects are still at the early stage of CO2 injection, and are not ready to be evaluated. 7 projects were assessed as discouraging. These projects barely provide any enhanced oil recovery and made unfavorable profit. Evaluations of the other 3 projects were not available. The pie chart below shows the proportion of different assessments. Overall, about 82% of the projects were encouraging and only 5% of the projects were unsuccessful.
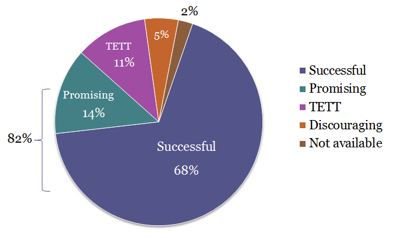
Figure 1 Evaluations of 134 CO2 projects.
Overall Reservoir Properties
Reservoir lithology
Below figure shows the percentage of CO2 flooding project applications in different formations in the last three decades. The pie chart indicates that about 55 percent of the projects were applied in carbonate reservoirs while about 37 percent in sandstone reservoirs. The other six percent were implemented in tripolite reservoirs. It is reported that CO2 flooding is not sensitive to reservoir lithology. There are more projects in carbonate reservoirs than in sandstone reservoirs because the largest CO2 field in the U.S. is in the Permian Basin, which is dominated with carbonate rocks.
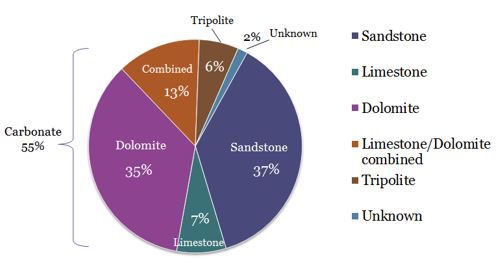
Figure 2 Reservoir lithology distributions of 129 projects
Reservoir porosity
A histogram and a box plot were generated to display the distribution of the porosity of all 134 projects. The range of porosity is from 4 to 29.5%. Two outliers were detected from the box plot. It can be observed that the histogram is distributed in a skewed shape. The three highest peaks in the range from 9 to 17. The box plot in Figure 13 shows the average is 14.3 and the median is 12.
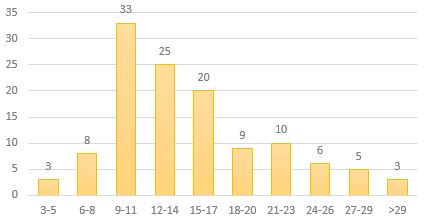
Figure 3 Reservoir porosity (%) distributions histogram
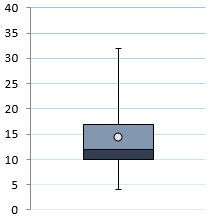
Figure 4 Reservoir porosity (%) distributions boxplot
Both histograms and boxplots look different when the porosity distributions are separated into sandstone and carbonate reservoirs. Distributions for two types of reservoirs are shown in the figures below.
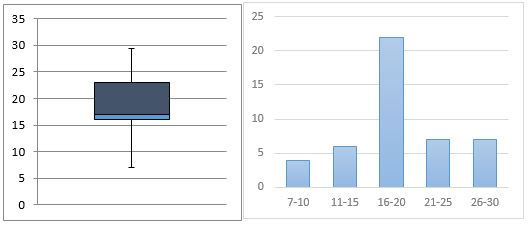
Figure 5 Porosity distributions of sandstone reservoirs (a) box plot and (b) histogram

Figure 6 Porosity distributions of carbonate reservoirs (a) box plot and (b) histogram
For the sandstone porosity distribution, it can be seen that the porosity range is from 7 to 30 and the histogram displays in a normal shape. The maximum peak is the range from 16-20. For the carbonate reservoirs, the box plot shows that the porosity is distributed more concentratedly. Most of the data falls into the ranges of 6-10 and 11-15. A better comparison can be perceived from the histogram below. Porosities are obviously distributed in the smaller ranges for carbonate reservoirs than sandstone ones.
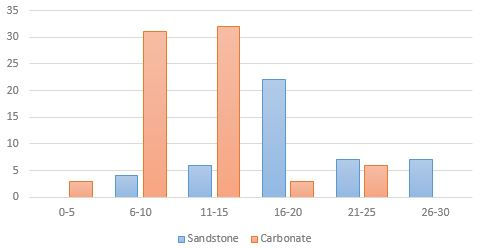
Figure 7 Comparison of porosity distributions between sandstone and carbonate reservoir
Reservoir permeability
After data cleaning, permeability data from 125 out of 127 projects were analyzed. The permeability of those 125 projects is in a reverse J distribution as displayed in Figure 18 and ranges from 2 to 700 mD as shown in the boxplot below. The boxplot also indicates that most permeability values fall into the range of 0-50 mD. Carbonate reservoirs are predominately in the low permeability range of the distribution.
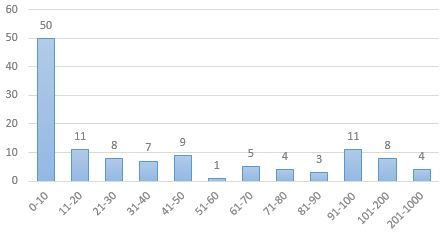
Figure 8 Permeability distribution histogram
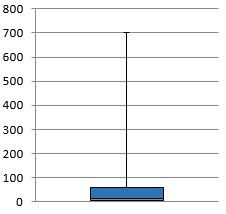
Figure 9 Permeability distribution boxplot.
In Figure 10 below, sandstone reservoirs and carbonate reservoirs permeability were marked in different colors for better comparison. The sandstone permeability (blue) is evenly distributed on the x-axis. Carbonate reservoirs (red) permeability are distributed extremely. Almost half of the permeabilities are below 10mD while about 20% of the permeabilities are greater than 100mD. The reason for this phenomenon is that carbonate reservoirs are in general, naturally fractured geologic formations characterized by heterogeneous porosity and permeability distributions (E.J. Manrique etc.).
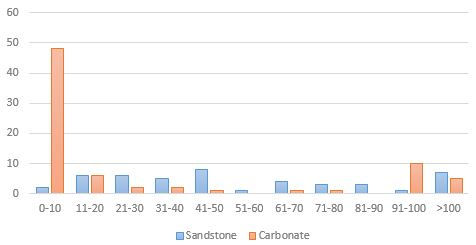
Figure 10 Sandstone and carbonate reservoir permeability distributions.
Reservoir temperature
Reservoir temperature is an important parameter in a CO2 flooding operation. CO2 minimum miscibility pressure is a direct function of temperature and it increases linearly corresponding to temperature (Jarell, Fox et al. 2002). MMP increases as temperature increases. For some high temperature reservoirs, achieving miscible flooding is impossible because if MMP is higher than the formation fracture pressure, injection at MMP will cause the formation to fracture and thus creating CO2 pathways.
Reservoir temperature was obtained from 124 projects. Figure 11 show the distribution of the reservoir temperatures. The minimum is 83 °F and the maximum is 260 °F. The maximum temperature is from the Cranfield reservoir in Mississippi where the temperatures of 11 other projects in the nearby area are above 220 °F. In these cases, CO2 minimum miscibility pressures were calculated above 3000 psi.
According to an empirical correlation of CO2 MMP provided by the National Petroleum Council, for reservoir temperatures greater than 120 °F, additional pressure is needed to achieve miscibility. Additional pressure ranges from 200 to 500 psi. Thus, for CO2 miscible flooding, reservoir temperatures less than 120 °F are preferred. As shown in the histogram below, more than 50% of the reservoir temperatures are lower than 120 °F.
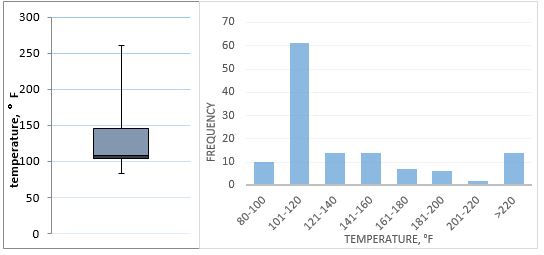
Figure 11 Reservoir temperature distributions (a) box plot and (b) histogram
Although there is no direct relationship between lithology and reservoir temperature, distribution shows a significant difference between sandstone and carbonate reservoir temperatures. One probable reason is that carbonate reservoirs have relatively lower fracture pressure than sandstone reservoirs. The carbonate reservoirs that have a temperature lower than 120 °F are better candidates than carbonate reservoirs with higher temperatures.
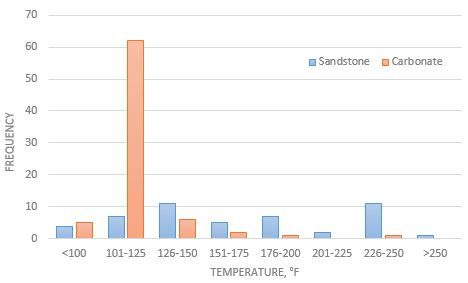
Figure 12 Sandstone and carbonate reservoir temperature distributions.
Reservoir depth
As mentioned previously, there is a threshold depth for CO2 misciblity with reservoir oil. Two widely accepted CO2 miscible threshold depths are 2,500 ft (J.J Taber; Gao.P et al) and 3,000 ft (Aziz. A et al). Even though 2,500 ft is taken as the threshold depth, there are 6 projects that have CO2 injected below this depth. From the boxplot in Figure 23, the depth is as shallow as 1,150 ft which is much shallower than 2,500ft.
Five out of six low-depth projects are from the Salt Creek field which is located in Natrona County, Wyoming. Literature shows that the field has an initial pressure of 1,750 psi. Oil gravity are varies from 35 to 39 °API while the reservoir temperature varies from 99 to 112 °F. Using the oil gravity and temperature, the minimum miscibility pressure could be roughly estimated in the Figure 24 below. The estimated MMP is in the range of 1300 to 1500 psi, which is smaller than the initial reservoir pressure. Miscibility can be achieved in such conditions. The other shallow field is the Northwest Velma Hoxbar field that is located in central Oklahoma. So far, no literature is available on this field. According to the dataset, the Northwest Velma Hoxbar field has a temperature of 84 °F, oil gravity of 27 °API, and viscosity of 2.4 cp. MMP estimated to be below 1,500 psi. Even though low temperatures provide a favorable condition for miscibility, it is remarkable that 84°F is below the carbon dioxide critical temperature (88 °F) which means the CO2 is miscible with the oil in a liquid state. In a liquid state, CO2 is more viscous and denser compared to being in a gas or supercritical state.
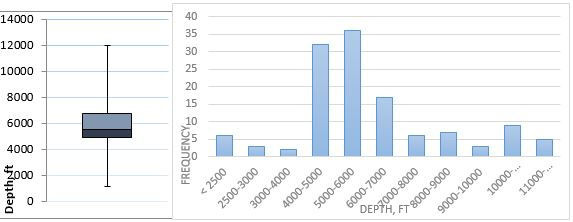
Figure 13 Reservoir depth distributions (a) box plot and (b) histogram
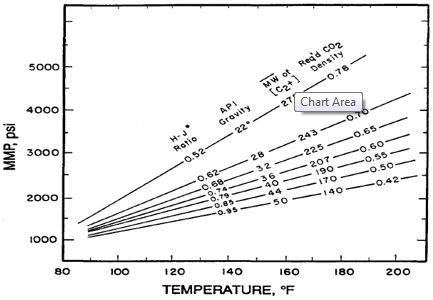
Figure 14 Variation of MMP with temperature and oil composition
The comparison between sandstone and carbonate reservoirs depth distribution is similar to the temperature distribution. There is no clear relationship between depth and reservoir lithology, likely reason due to more carbonate candidates than sandstones and the carbonate sandstones’ and their regions are more concentrated.
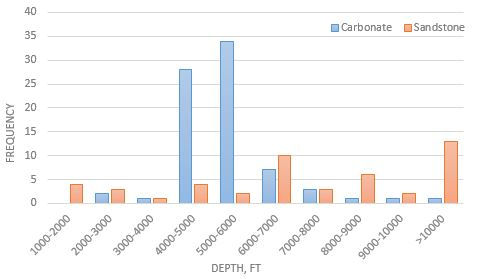
Figure 15 Sandstone and carbonate reservoirs CO2 injection depth distribution comparison
Reservoir oil saturation before CO2 flooding
Even though reservoir oil saturation is not a main factor that CO2 displacement depends on, many researchers still take it into account as a rough guideline for economic concern. Generally, for a successful CO2 miscible flooding, oil saturation should not be less than about 20% PV (Gao et al, 2010). As is shown in the Figure 16 below, the oil saturation at the beginning of the projects is as high as 89% PV among all 108 projects. The average value is about 50%PV which indicates good reservoir candidates. The minimum value is 26.3% PV which is greater than the screening criteria limit mentioned above.
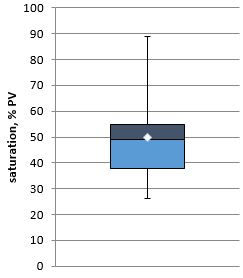
Figure 16 Start reservoir oil saturation (%PV) boxplot.
Net pay thickness
Although reservoir net pay thickness is not considered as a screening criteria for CO2 flooding by previous researchers, it is regarded as a critical parameter for flooding success estimation. Thick net pay is economic and productively beneficial while thin layers could avoid CO2 gravity segregation to some extent. According to Song (2014), when the net thickness is less than 30 m (98.4 ft), the increase of the net thickness would increase the technical efficiency of WAG flooding.
The net pay thickness summarized from 25 CO2 miscible flooding projects is shown in Figure 17 below. This value has a range of 15 – 268 ft. Most of the values are in the range of 75 – 137 ft which indicates both economic and recovery favorable.

Figure. 17 CO2 flooding projects reservoir net pay thickness distribution boxplot
Reservoir Fluid Properties
Collected reservoir fluid properties include oil gravity and oil viscosity. Typically, oil composition is described using only the gravity. The unit “API” stands for the American Petroleum Institute. API gravity is a measurement of how heavy the oil is.

Factors that affect viscosity are oil composition, temperature, dissolved gas, and pressure. Normally, the heavier the oil is or the smaller the API gravity is, the more viscous the oil will be. Above the bubble point pressure, the viscosity increases with pressure increase. The viscosity is lower with higher temperature.
Oil gravity
125 projects provided their oil gravity data, most of the values are between 32 to 43 °API which indicates light oil reservoirs. The heaviest oil is 27 °API from the Northwest Velma Hoxbar field in Oklahoma. Relatively shallow reservoirs account for slightly heavier oil gravities. Theory and field applications both demonstrate that light oil reservoirs are better candidates for CO2 miscible flooding.
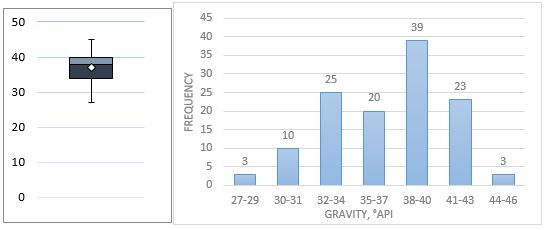
Figure 18 CO2 flooding oil gravity (°API) distribution (a) boxplot and (b) histogram
Although there is no direct relationship between reservoir lithology and oil gravity, the distribution histogram shows a significant difference between the two types of reservoirs.
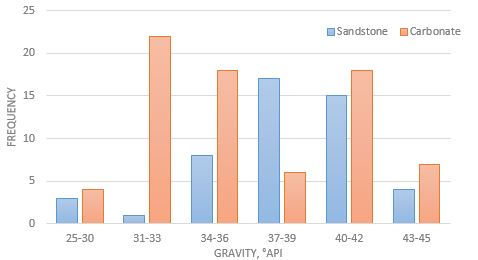
Figure 19 Sandstone and carbonate reservoir oil gravity distribution comparison
Oil viscosity
In consideration of the viscous fingering problem and other problems resulting from viscosity differences between carbon dioxide and crude oil, low viscous oil reservoirs are better candidates than viscous ones.
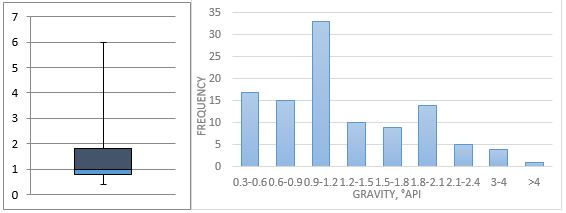
Figure 20 Oil viscosity distribution (a) boxplot and (b) histogram
Operation Property
CO2 minimum miscibility pressure
Only 22 projects provided CO2 minimum miscibility pressure data. MMP ranges from 1,020 psi to 3,452 psia, most in the range from 1,600 to 2,500 psia. CO2 minimum miscibility pressure is generally considered to be greater than 1,400 psia, well above 1,020 psia. The minimum value 1,020 psia is from the Goldsmith San Andres field. Minimum miscibility pressure is measured by slim tube experiments. A reservoir has favorable characteristics for low MMP when the temperature is 97 °F, crude oil is 37 °API, and oil viscosity is 0.7 cp (D.E. Jasek et al).
MMP could be lowered by the addition of additive gases such as SO2 and H2S when reservoir pressure is insufficient to reach miscibility. In general, the CO2 injection pressure is about 200 psia higher than the MMP to make sure miscibility can be achieved, or the pressure is between the MMP and the fracture pressure.

Figure 21 CO2 MMP distribution boxplot
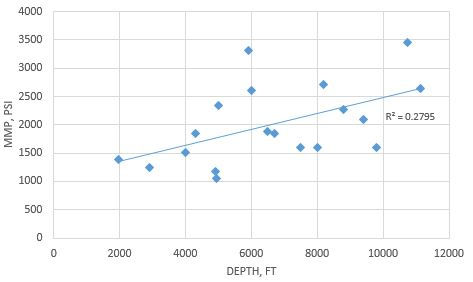
Figure 22 MMP with depth
Data Summary
This paper summarizes CO2 miscible flooding field application data and conducts a statistical analysis of the data set. Both summary and screening criteria table are generated based on cleaned data containing reservoir porosity, permeability, oil API gravity, oil viscosity, reservoir temperature, depth, oil saturation, and net pay thickness. For most characteristics, sandstone reservoirs and carbonate reservoirs are summarized both separately and combined. Four standard statistics including the minimum, maximum, median, and mean values are used to describe the criteria.

The two tables below represent CO2 flooding criteria summarized by previous researcher and this work. Previous reseachers includeTaber (2004), Ahamd Aladasani (2010) and Gao and Pan (2010). Different parameters were taken into consideration in these summaries. Screening criteria generated by this research is based on comprehensive consideration including previous criteria, general threshold level and dataset range standard statistics.

- This study summarized CO2 miscible flooding field application information and conducted further dataset analysis. Numerical analysis results represent the current U.S. CO2 miscible flooding reservoir candidate properties and demonstrated existing screening criteria. Although the choice of EOR method is never a result of simple factors, the summarized recommended range can still serve as a reference benefit for field engineers and researchers in the future.
- The recommended CO2 miscible flooding implementing reservoir and fluid properties can be summarized as follows: porosity >4%, permeability >2 mD, gravity: >27 °API, viscosity <6 cp, temperature <260 °F, oil saturation >20%PV, depth >2,120 ft, and net pay thickness between 75-137 ft.